 LINQ Insight and Flamory
Flamory provides the following integration abilities:
- Create and use window snapshots for LINQ Insight
- Take and edit LINQ Insight screenshots
- Automatically copy selected text from LINQ Insight and save it to Flamory history
To automate your day-to-day LINQ Insight tasks, use the Nekton automation platform. Describe your workflow in plain language, and get it automated using AI.
Screenshot editing
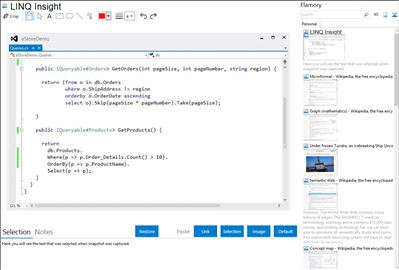
Flamory helps you capture and store screenshots from LINQ Insight by pressing a single hotkey. It will be saved to a history, so you can continue doing your tasks without interruptions. Later, you can edit the screenshot: crop, resize, add labels and highlights. After that, you can paste the screenshot into any other document or e-mail message.
Here is how LINQ Insight snapshot can look like. Get Flamory and try this on your computer.

Application info
LINQ Insight is a Visual Studio add-in that allows to execute LINQ queries at design-time directly from Visual Studio without starting a debug session, allowing you to test queries instantly after you write them. LINQ Insight also provides a powerful ORM Profiler tool for profiling the data access layer of your projects and tracking all the ORM calls and database queries from the ORM.
LINQ Insight integrates into Visual Studio 2010, 2012 and 2013. Entity Framework 6 is now supported in the latest version of the product.
Key features:
* Design-time LINQ Query Execution. Unlike different LINQ debug visualizers, LINQ Insight does not require you to start debugging and step to the LINQ query execution for viewing returned data and generated SQL. LINQ Insight allows you to test LINQ queries at design-time.
Just execute LINQ queries right from Visual Studio editor and view the result without leaving the IDE. Test your LINQ queries instantly after you write them.
LINQ Insight detects the used context and connection string automatically. LINQ Insight displays the returned data in a powerful grid with advanced data grouping, sorting and filtering. LINQ Insight supports both usual LINQ queries and queries through extension methods and can work with anonymous queries, for example, with immediate ToList calls.
* ORM Profiler. LINQ Insight offers true ORM profiler. It allows you to really profile application interaction with ORM runtime.
With LINQ Profiler tool you can see how much time LINQ statement or SubmitChanges call takes to execute as a whole even if it generated multiple SQL statements.
You profile exactly the code you write and study the real performance of your LINQ code. To start profiling a project you just need to open the LINQ profiler window, click the Start profiler session button on its toolbar. Then run the project and real-time data on ORM events.
Integration level may vary depending on the application version and other factors. Make sure that user are using recent version of LINQ Insight. Please contact us if you have different integration experience.