 Touchgraph Navigator and Flamory
Flamory provides the following integration abilities:
- Create and use window snapshots for Touchgraph Navigator
- Take and edit Touchgraph Navigator screenshots
- Automatically copy selected text from Touchgraph Navigator and save it to Flamory history
To automate your day-to-day Touchgraph Navigator tasks, use the Nekton automation platform. Describe your workflow in plain language, and get it automated using AI.
Screenshot editing
Flamory helps you capture and store screenshots from Touchgraph Navigator by pressing a single hotkey. It will be saved to a history, so you can continue doing your tasks without interruptions. Later, you can edit the screenshot: crop, resize, add labels and highlights. After that, you can paste the screenshot into any other document or e-mail message.
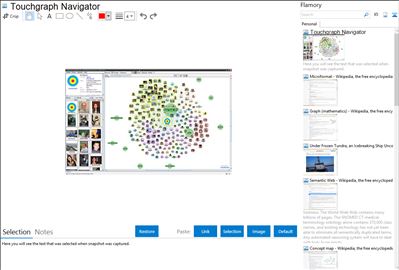
Here is how Touchgraph Navigator snapshot can look like. Get Flamory and try this on your computer.

Application info
TouchGraph is the producer of data visualization software TouchGraph Navigator 2. With TouchGraph Navigator 2, users can upload data and create "interactive network visualizations."[1] Users can purchase licenses for either a TouchGraph Navigator Desktop version or TouchGraph Navigator Web, where the user hosts visualizations on their server and views the visualization on a web browser.[1]
Use
Users first load the data (in Excel, Csv, Tsv, Multi Csv, MySql, Nav DB API, Vna, Gdf, or Pajek formats), and they then can define:[2]
Data types and delimiters - Data type (integers, text, url, etc) and delimiters of table fields.
Entities and relations - Specify how table data is transformed into Entity types and Relation types.
Dynamic relations - Direct connections between entities which were only indirectly connected in the data.
Dynamic attributes - Attribute that is derived from loaded data rather the being read directly from the file.
Aliases - Renaming entities, relations, and attributes.
Users then define the settings
Names: Types/Attributes, Entity Labels
Filter: Inclusion (which node types and edge types will be displayed in the graph), Attribute Filters (threshold values which determine which nodes and edges are displayed in the graph)
Node Appearance: Colors, Halo Size/Shape, Label/Image, Node Tags
Edge Appearance: Colors, Width/Pattern, Tags/Arrows
Graph Layout
Integration level may vary depending on the application version and other factors. Make sure that user are using recent version of Touchgraph Navigator. Please contact us if you have different integration experience.